Monitoring pages that don't exist until JavaScript runs them
Some pages are an empty div until JavaScript builds them. How to tell whether you need a real browser, why rendering adds noise instead of removing it, and which check tier holds on each kind of page.
A monitor watched a competitor's pricing page for three weeks and reported nothing. No alerts, no failures, green checks the whole way. Then the plan lineup changed, and still nothing arrived.
The snapshot explained it. What the fetch had captured was this:
<div id="root"></div>
Plus a script tag and a stylesheet link. The check ran fine. There was just nothing in it to compare.
If you want to monitor a JavaScript-rendered page for changes, this is the first thing that goes wrong, and it's the only part the internet talks about. The second thing that goes wrong is worse. It happens right after you fix the first one.
First, find out whether you actually need a browser
Before you escalate anything, run the 30-second test. Open the page and view the raw source (Ctrl+U, or view-source: in front of the URL). Not the inspector. The inspector shows you the DOM after JavaScript has run, which is exactly the thing you're trying to rule out.
Then Ctrl+F for a string you care about. A price. A plan name. A subprocessor's name. A version number.
If you find it, stop. Your page is not a JavaScript-rendered page for monitoring purposes, whatever framework it was built with. A plain fetch can see your text, which means the exact diff or semantic tier is enough. It's faster, cheaper, and there's less to go wrong.
If you search for $49 and get nothing, keep reading.
The case where the data is sitting right there as JSON
Half the pages people describe as "JavaScript-rendered" ship their content in the HTML anyway, just not as visible markup. Server-rendered and hybrid frameworks routinely embed the page's data as a JSON blob in a script tag. Next.js has done it under __NEXT_DATA__, and plenty of hand-rolled apps do the same with a window.__INITIAL_STATE__ assignment.
Search the raw source for your price with the currency symbol stripped. Then search for it inside quotes. "price":49 is your text. It's in the HTML. No browser required.
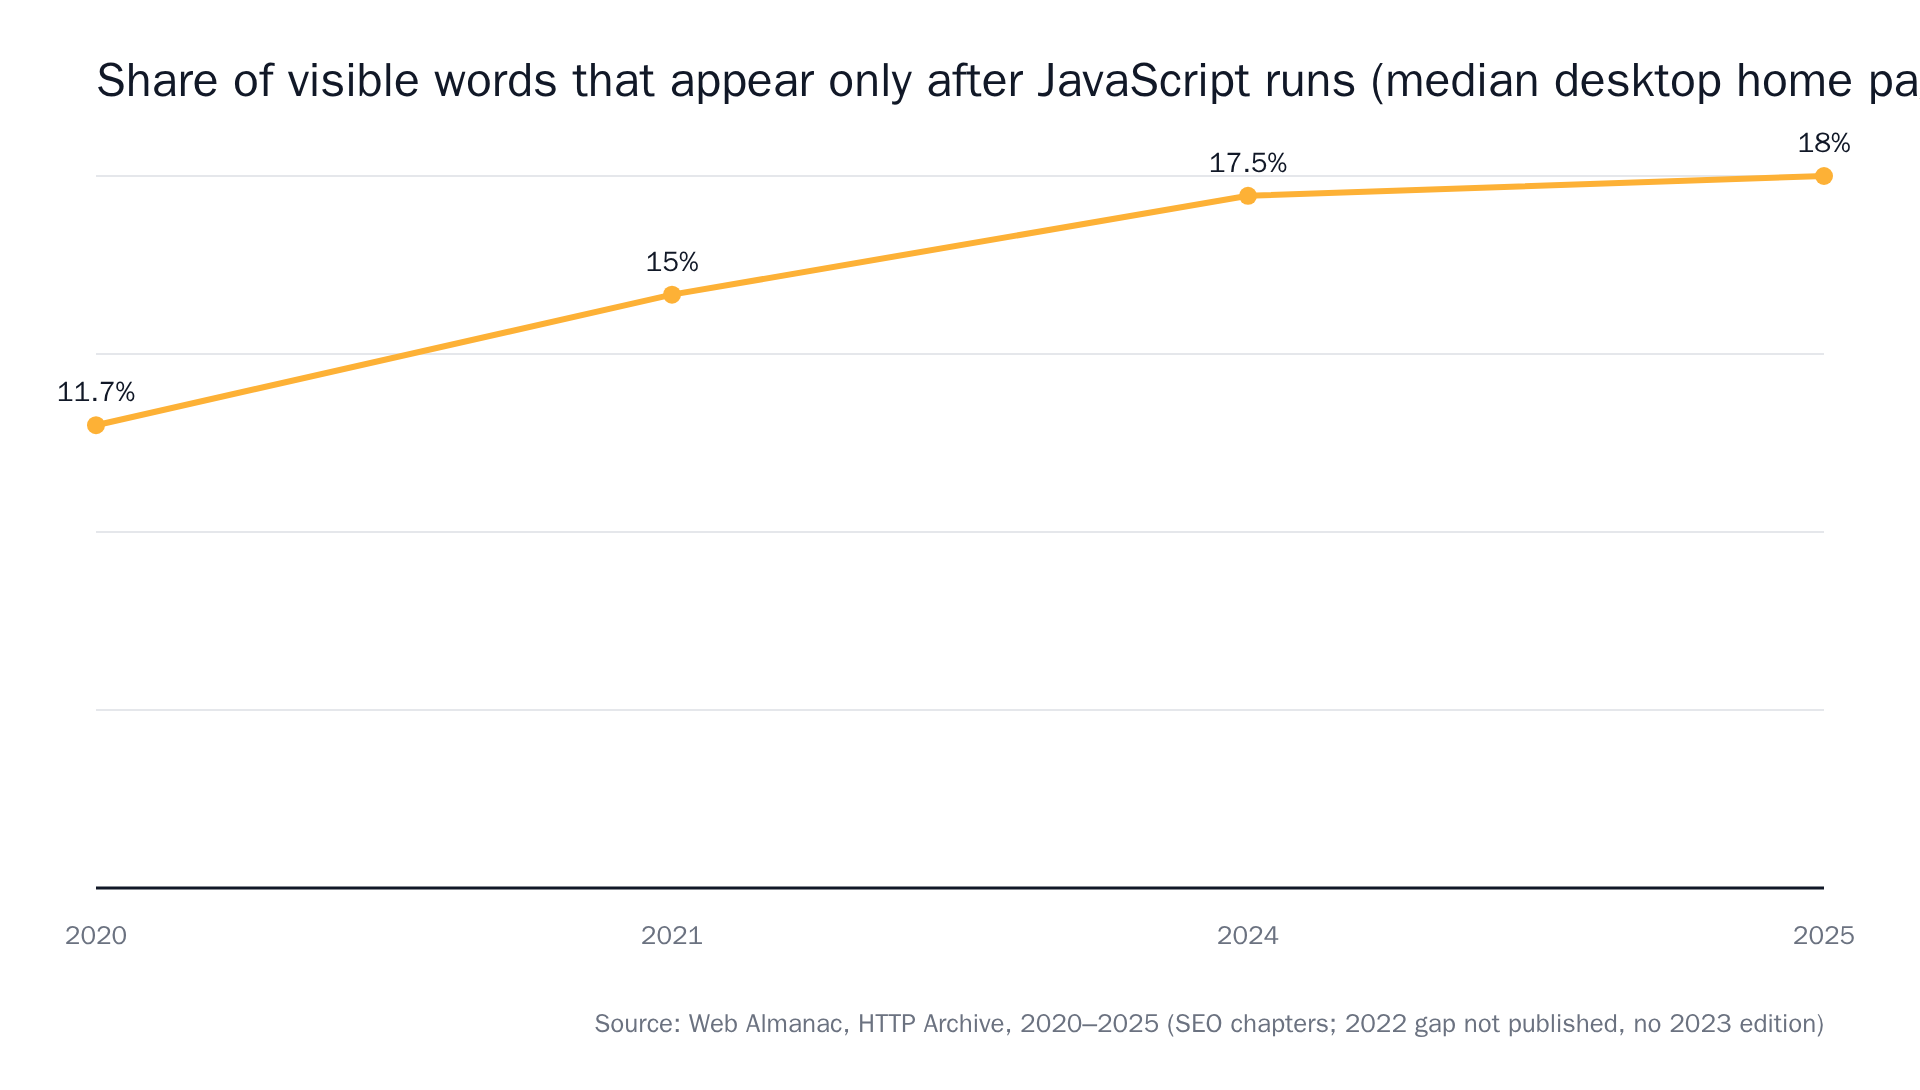
This matters more than it sounds. The gap between rendered text and raw text on the median page is real, but it isn't the whole page:
 Source: The Web Almanac by HTTP Archive.
Eighteen percent of the median page's words arriving only after JavaScript runs is a lot. It is also not a majority. Test your page before you assume it's in the eighteen.
Why "just wait for the page to load" doesn't mean anything
Say the test comes back empty and you genuinely need a browser. Every guide's advice at this point is some version of "enable JavaScript rendering and add a wait." That advice hides the entire difficulty.
"Loaded" is at least three different moments, and none of them means "the content is there."
DOMContentLoaded fires when the HTML is parsed. On a client-rendered app, that's the moment the empty root div exists. The load event fires when subresources are done, which on a single-page app can still be before the first API call resolves. And then there's network idle, the wait everybody reaches for.
Playwright's own API docs mark networkidle DISCOURAGED, define it as "wait until there are no network connections for at least 500 ms," and tell you to assert on page state instead (playwright.dev). There is a lint rule whose entire job is banning it: no-networkidle in eslint-plugin-playwright. Puppeteer at least gives you a choice of definitions: networkidle0 is zero connections for 500 ms, networkidle2 tolerates up to two (browserless.io).
The failure mode is easy to picture. One analytics beacon on a heartbeat, or a long-polling notifications endpoint, and the page never goes quiet. Your wait times out, and the timeout is indistinguishable from a broken page.
The fallback everyone lands on is a fixed sleep. Checkly's Playwright docs name that an anti-pattern, and they're right: five seconds is too long on a fast day and too short on the day the origin is slow, which is the day the change you care about shipped.
What "settle" has to mean in practice
A check that actually reads a client-rendered page does a sequence, not a sleep. Launch real Chromium. Wait for the page to settle. Dismiss the cookie banner, because on a lot of sites the consent overlay blocks the very region you want. Scroll, because lazy-loaded sections below the fold don't exist until something scrolls past them. Open the tab, if the pricing table hides behind "Annual." Then read.
That's what modsignal's browser agent tier does before any judgment happens. It's plumbing, and it's the boring half.
Rendering fixes one problem and creates a bigger one
Here's the part nobody writes about. You turn on the browser, the empty diff goes away, and the alerts start. One every check. None of them about pricing.
A real browser picks up everything a real browser picks up:
- The skeleton. Catch the page a beat early and you diff grey placeholder bars against actual content. Catch it a beat late the next run and you diff back the other way. Two alerts, zero changes.
- The session ID. CSRF tokens, request IDs, cache-busting query strings in image URLs. Fresh every load, by design.
- The relative timestamp. "Posted 3 hours ago" becomes "Posted 4 hours ago." Byte-for-byte, that is a change. It is also the least interesting change on the internet.
- The consent iframe. Third-party markup injected on load, with its own class name hashes that rotate on the vendor's schedule, not yours.
- The carousel. Logo strips, testimonial rotators, "most popular" badges that move with the quarter. All rendered, all different, all noise.
- The hydration race. Same content, two orderings, depending on which API call resolved first. The text is identical. The document isn't.
Point a byte-for-byte diff at a rendered single-page app and you have built a pager, not a monitor. This is the actual reason people give up on monitoring JavaScript-heavy pages, and it happens after they solved the rendering problem, which is why the rendering-focused guides never mention it. If you're already in this hole, we wrote a longer list of why monitors cry wolf and what to do about each cause.
One related detour, while we're here: watching the JavaScript files themselves. Some tools will alert you when app.a91f3c.js becomes app.7d20b8.js. That tells you a deploy happened. It doesn't tell you what shipped, and on a weekly release train it fires whether or not anything on the page moved. Watching the bundle is not watching the page.
Render, then judge
Rendering and judging are two different jobs, and the whole category tends to collapse them into one checkbox.
Rendering gets you a readable page. Something still has to decide whether what changed is the thing you asked about.
On the browser agent tier, modsignal renders and settles the page, then applies the same semantic judgment the AI tier uses: one model check per run, reading the fresh page against the last snapshot plus your prompt, answering one question. Did the described change happen? If the answer is no, nothing is sent. The skeleton flicker, the rotated session ID, the timestamp ticking over — the renderer picked all of it up, and none of it becomes an alert.
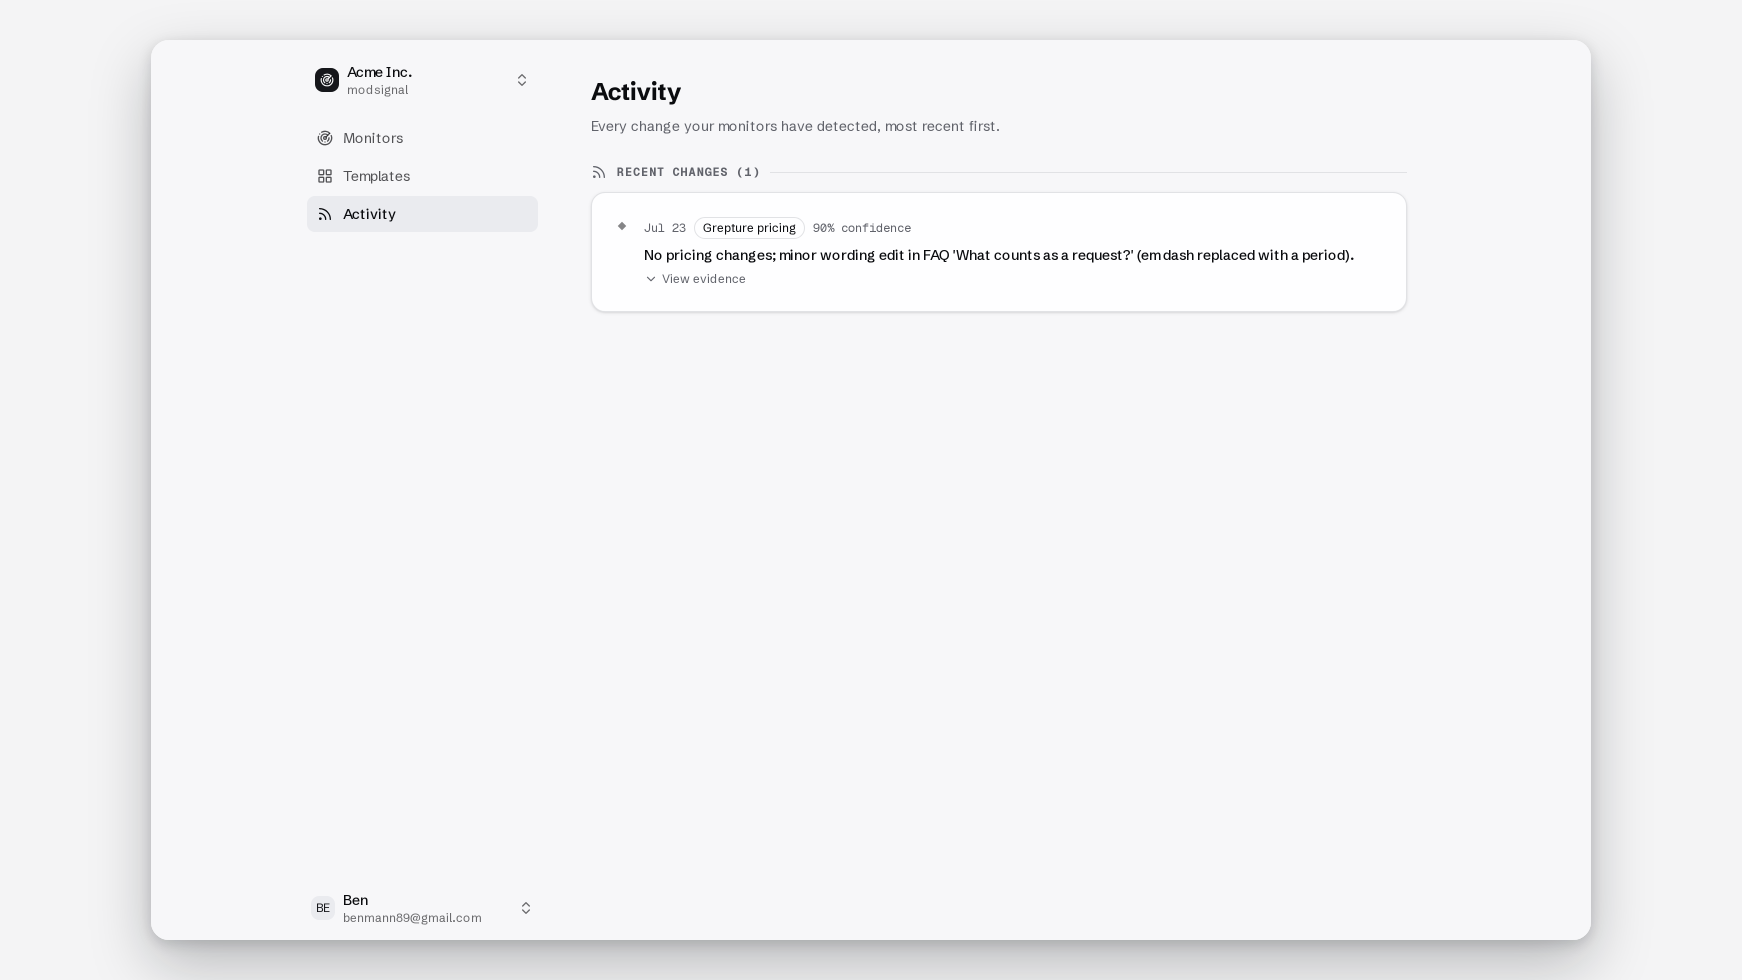
When the answer is yes, the alert carries one summary sentence, before and after excerpts, a confidence score (the model's own uncertainty, shown rather than buried), and a full-page "page as checked" screenshot. On a client-rendered page that screenshot earns its keep, because it's the only record of what the DOM actually looked like at 04:12 when the check ran. Every alert links back to the monitor timeline, which holds the full history.
The bar we hold ourselves to: you should be able to forward that alert into a Slack thread or paste it into a ticket without anyone reopening the page.
Write the prompt for the change, not the region
On a static page you can get away with describing where to look. On a rendered page the region moves. Components remount, order shifts, class names are hashed at build time. The change doesn't move.
Bad:
Watch the pricing table in the middle of the page.
Good:
Tell me if any plan's monthly price changes, a plan is added or removed, or the free trial length changes.
The second one survives a redesign. The first one dies the first time someone reorders a flex container. There's a fuller treatment in our guide on writing a monitoring prompt if you want the patterns.
Where the browser tier struggles
"It renders JavaScript" gets sold as an unqualified good, so here are the limits.
It's the slowest tier. Launching Chromium, settling the page, dismissing banners and scrolling takes real seconds per run, and it's the most expensive tier per check we run. That's why it's a per-monitor choice rather than the default.
It doesn't get through a login wall. If the content lives behind authentication, the agent sees the sign-in form, and it will faithfully tell you the sign-in form hasn't changed.
Aggressive bot protection stops it. Some sites challenge headless Chromium, and when they do, the honest outcome is a failed run rather than an invented answer.
And content that only appears after a search you can't express as "open the tab, scroll down" is out of reach. If the thing you want requires typing a postcode and picking a date, the agent isn't the tool.
The last limit is the one people ignore: if your text is in the raw source, the browser agent is the wrong answer even though it works perfectly. You'd be paying more, waiting longer, and inviting rendering noise into a page that never had any.
Credit where it's due. If you'd rather run this yourself, changedetection.io ships a Playwright content fetcher and a Browser Steps UI for clicking, scrolling and filling before the diff, it's self-hostable, and it's genuinely good at it. The ceiling is scripting: an open request from August 2025 asks for full Playwright scripts inside Browser Steps, which tells you where people run out of room. If you like maintaining that, maintain it. We wrote up what a DIY monitoring script actually costs six months in if you want the other side of that argument.
The simple rule
- Your text is in view-source → exact diff (quiet pages, every change matters) or semantic (busier pages).
- Empty root div, content appears on load → browser agent.
- Content behind a tab, a scroll, or a cookie banner → browser agent.
- The bundle hash changed and you want to know what shipped → watch the page, not the file.
- The tier you picked is noisy → the tier is probably right and the prompt is probably a region description.
What it costs to run the test
The free plan is $0, no card: 3 monitors, daily checks, exact diff and semantic. That's enough to run the view-source test against the pages you actually care about and find out how many of them need a browser at all. Our guess, based on the pages people bring us, is fewer than you'd think.
The browser agent tier is on every paid plan, starting at Pro, $25/mo for 25 monitors and 15-minute checks. Switching a monitor from semantic to agent is a dropdown, not a migration, and checks are never metered, so a page that needs a real Chromium every 15 minutes costs the same as one that doesn't.
Rendering is the easy half. Deciding what mattered is the job.