Seven reasons your page monitor cries wolf (and what to do about each one)
A/B tests, cookie banners, bot walls, dead selectors: the seven things actually firing your false positives, what's happening under each one, and the fix, including the three fixes that aren't a product.
You set up nine monitors in March. Competitor pricing, two vendor DPAs, a status page, a couple of job boards. By May you had a mail rule sending all of it to a folder you open on Fridays. Maybe.
That's what "website change monitor, too many false positives" looks like in practice. Nobody decides to stop trusting the tool. A filter rule gets added on a busy afternoon, and the whole thing quietly switches off. The usual fix makes it worse: tighter thresholds and a growing list of exclusion rules — really a list of every surprise you've already had. Thresholds cut the wrong way too. A common piece of advice is to ignore changes under 5% of page content. On a 3,000-word pricing page, the line that moves a plan from $12 to $15 per seat is about 0.1%.
Here's what's actually firing them, and what to do about each one.
First, how many false positives are normal?
More than you think. Visualping, the biggest name in page monitoring and for good reason, publishes its own signal-to-noise ratio, which is an unusually honest thing to do. Across a recent 30-day sample they report roughly 16.8 million page-level changes across about 1.5 million active monitors, of which their classifier marked 11.5% as important and filtered 88.5% as noise. Elsewhere they put the filtering rate at 83%. (Figures as published on their blog, checked July 2026; check their site for current numbers.)
Take that at face value. Around nine in ten detected changes are not the change anyone asked about. That's not your bad luck or your bad setup. That's the baseline for anything that answers the question "are these two strings different?"
A diff answers that question correctly every single time. It's just not the question you asked.
1. You're watching a region, not a change
In your inbox: an alert with a highlighted box, and nothing in the box looks different.
Region-based monitoring fires when anything inside the selected area moves. The area always contains more than you think it does: a "most popular" badge, a support widget, a testimonial that rotates, a footer year. You picked the region because it contained the price. It also contains fourteen other things.
The fix: describe the change in a sentence instead of drawing a rectangle. "Alert me if the Pro plan's monthly price changes or the number of included seats changes" is a claim a check can be true or false about. A box is not.
If the page is genuinely quiet (a spec sheet, a subprocessor table), skip all of this and use byte-for-byte exact diff. On those pages every change is signal and judgment is a liability.
2. The page isn't the same page twice
In your inbox: an alert saying a plan appeared. Then, a few hours later, an alert saying it disappeared.
A/B tests assign visitors to variants at random. A 70/30 split is routine, and pricing tests go further than button colours: variants add or remove an entire tier. Two consecutive checks can land in two different buckets with zero underlying change. Currency toggles, regional banners and geo-set prices do the same thing at a slower tempo. The page your monitor reads is the one served to its IP, not the one your rep is looking at.
The fix: watch for the flip-flop tell. If an alert reverses within a day, it's a test, not a launch. Don't act on it, and widen the prompt slightly so a single-variant sighting doesn't count as a change. There's more on this in our guide to monitoring a competitor's pricing page without drowning in noise, because pricing pages are where this problem lives.
3. You're diffing the furniture
In your inbox: a unified diff whose only red-and-green line is a timestamp.
"Last updated 4 minutes ago." View counters. Session and CSRF tokens embedded in the markup. Cache-busting query strings on asset URLs. Carousels. Ad slots. Distill names date counters and layout adjustments as the classic false positives of full-page monitoring, and they're right. A byte comparison has no way to know that a number incrementing every minute is furniture.
The fix, honestly: two options, and one of them isn't us. You can list the furniture and exclude it, which works fine on a page you've watched for a while and breaks the first time they add a new widget. Or you move to a tier that judges the change rather than counting it, so nothing needs listing. If you're deciding between the two, we wrote up how each check tier decides something changed.
4. Your monitor is reading a cookie banner
In your inbox: an alert whose before/after excerpt is entirely about your privacy choices.
Consent overlays, region interstitials, app-install prompts and paywall gates sit between the fetcher and the content. They rotate their copy, they change which vendors they list, and on some pages they suppress the content underneath until dismissed. Your monitor faithfully reports on the banner because the banner is what it was shown.
The fix: a real browser. Our browser agent tier launches Chromium, waits for the page to settle, dismisses the banner, then applies the same judgment. It also attaches a full-page "page as checked" screenshot, which ends the argument about what the monitor actually saw. That's the expensive tier per check, which is why it's a choice and not the default.
5. The page hadn't finished loading
In your inbox: "the pricing table was removed." It wasn't.
Client-side rendered pages (React, Vue, most modern app marketing sites) ship an HTML shell and build the visible content in the browser. A plain HTTP fetch gets empty containers. Lazy-loaded sections arrive after first paint. Failure looks exactly like deletion, and then the recovery looks exactly like an addition, so one slow response costs you two alerts.
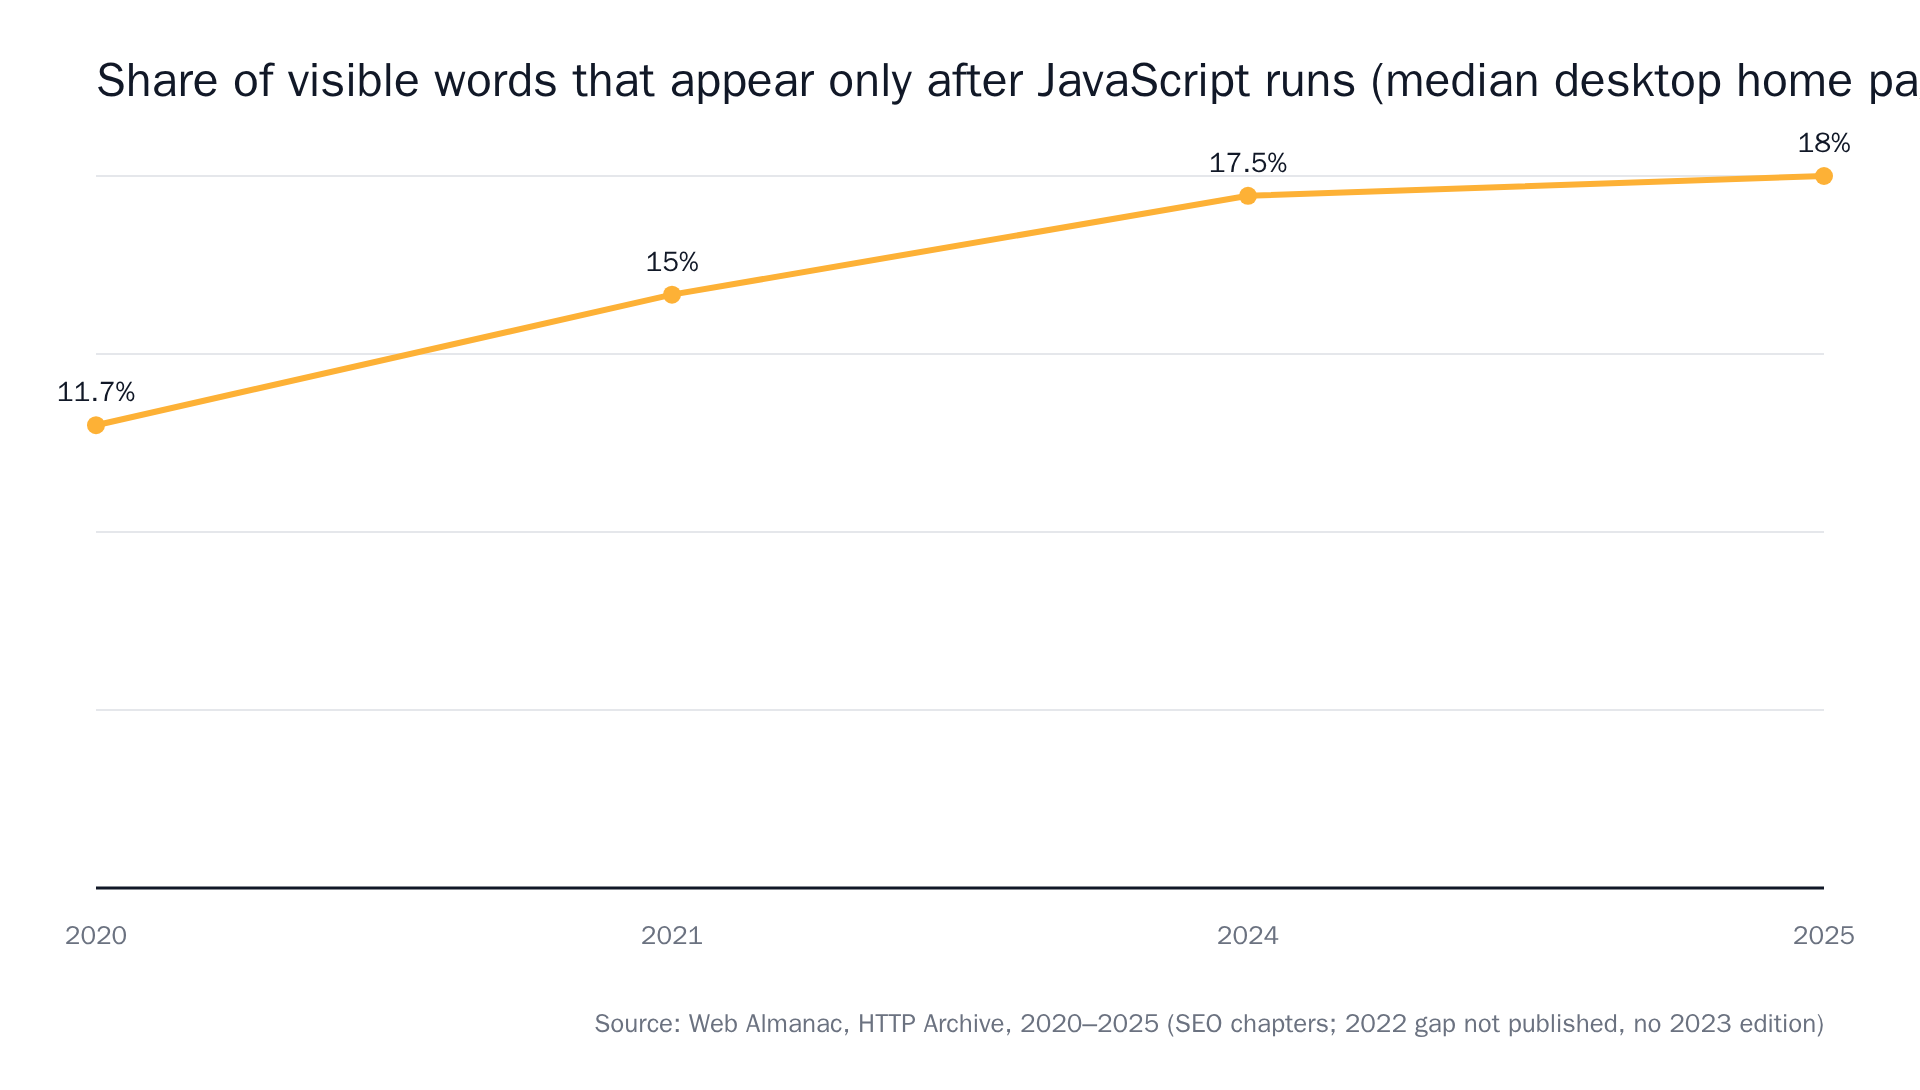 Source: Web Almanac by HTTP Archive, SEO chapter, 2020, 2021, 2024, 2025.
This is common enough that tools build around it. Distill's config surfaces a SELECTION_EMPTY error when a watched element has no text, and defaults ignoreEmptyText to true, precisely because empty doesn't mean removed. Their documented fix is a delay you set yourself, in seconds.
The fix: run the test first. Open the page, view the raw source (View Source, not the inspector; the inspector shows you the page after JavaScript has run), and search for the text you care about. If it isn't there, no filter, threshold or exclusion rule will help you. You need a browser. And prefer a monitor that waits for the page to settle over one where you type a number into a box. A fixed delay is a guess that's wrong twice: too short on a bad day, too slow every other day.
6. You weren't blocked, you were... actually, you were blocked
In your inbox: the entire page changed. All of it. At once.
Bot protection returns a 403, a challenge page or a CAPTCHA, and a naive monitor stores that as its new snapshot. Cloudflare scores datacenter IP ranges low by default, and a fresh VPS can start life with poor reputation, so this hits self-hosted scripts hardest. You get two alerts: one when you're blocked, one when you're let back in.
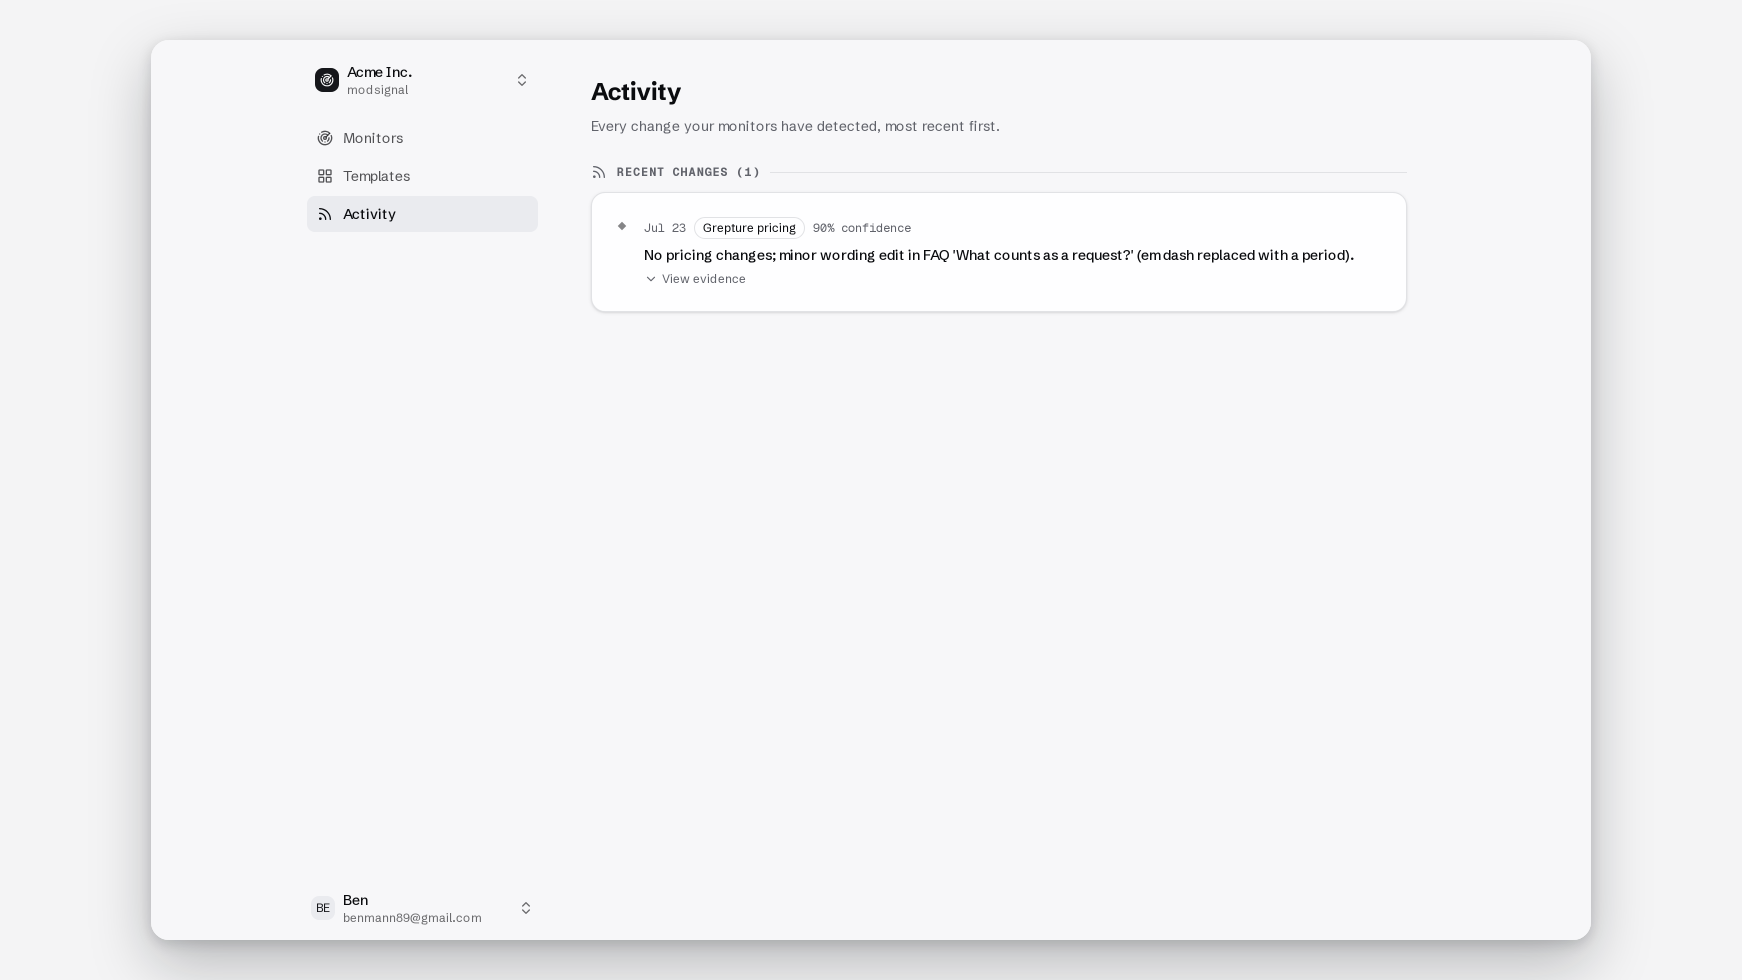
The fix: treat a whole-page rewrite as a suspected fetch failure rather than a change, and check the evidence before you act on it. If the before/after excerpt contains the words "verify you are human," you have a fetching problem, not a competitor problem.
7. The selector was fine until the redesign
In your inbox: nothing, for six weeks. Which felt great.
Here's a real XPath from a changedetection.io discussion thread, generated by a visual element picker: